BNB price hits new high of $1110, technical indicators point to further gains
04.10.2025
News / Analytics
BNB price hits new high of $1110, technical indicators point to further gains
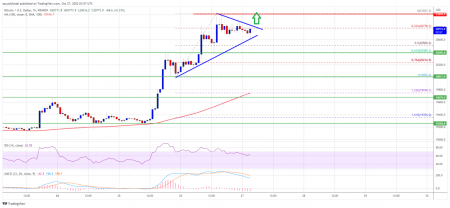
On Friday, October 3, the BNB price reached a new all-time high of $1,110.9. This is 31% higher than last month's low and 107% higher than this year's low.The daily chart shows that BNB has been steadily rising since late June. It broke through a key resistance level at $797.7, which it reached on December 4.
The BNB price rose above all key moving averages, with the 50-day SMA crossing the 200-day SMA, forming a bullish "golden cross" pattern, which historically precedes strong gains over several weeks or months.
In technical analysis, this pattern forms when an asset trades between two ascending parallel trendlines. It typically indicates a sustained uptrend and suggests increasing profits as long as the price remains within the channel. A break above the upper trendline serves as an even stronger bullish signal and often indicates accelerating upward momentum.
The MACD lines are also pointing upward, and the green histograms are rising. Aroon Up is at 100%, and Aroon Down is at 50%. This situation indicates that buying pressure significantly exceeds selling pressure.
Therefore, BNB will likely continue its move toward the psychological resistance level of $1200.
Similar news:

23.08.2023
22.05.2023

15.11.2022